
3 min Read
30 Local Digital Marketing Stats Every Franchise Marketer Must Know in 2024
It’s been a minute since we last posted about the local digital stats that marketing leaders at franchise brands and multi-location businesses must take into account in building winning strategies.
Much has changed in a short time. Thus the list below covers everything you need to assess your priorities, strategies and allocation of resources.
Over 90% of these statistics were published Q3 2023 or after – this is the current state. Are you fully equipped to be addressing these realities?
Local Search Frequency and Usage
1. 97% of consumers use online sources to find more information about local businesses.
2. 88% of potential customers look for online reviews before choosing local services.
3. Google is used by 81% of consumers to check out local businesses.
4. 46% of all Google searches are seeking local information.
5. 80% of U.S. consumers search for local businesses WEEKLY.
6. 32% of U.S. consumers use the Internet to research a local business MIN. 2X PER WEEK.
7. 21% of U.S. consumers use the Internet to find a local business EACH DAY.
Local Search Impact and Conversion
8. 80% of local searches result in leads, sales, visits, or desired actions.
9. 78% of location-based mobile searches result in an offline purchase.
10. The number of searches for “near me” has increased by 500% in recent years.
11. 84% of “near me” searches are on mobile.
12. Over 50% of all “near me” searches will result in an offline store visit.
13. 28% of searches for “near me” lead to a purchase.
Mobile Search Trends
14. 60% of Google searches come from a mobile device, but just 34% of conversions come from mobile.
15. 43% of consumers conduct an online search while they are in a store.
16. 29% of people search for a local business on their smartphone at least once a week.
17. Images appear 12.5 times more often on mobile search results vs. desktop.
18. Users take more time to make a decision when searching on mobile.
Voice Search
19. Half of the U.S. population uses voice search each day.
20. Voice search is especially popular with younger adults, with 58% of consumers between 25 and 34 using it daily.
Video and Interactive
21. Video content is 5x more likely to lead to a conversion than content alone.
22. Interactive content sees 52.6% more engagement than static content.
23. Web pages that include a video are 53% more likely to be displayed on page 1 of Google.
Ad Performance and Consumer Preferences
24. Search ads can increase awareness by up to 80%.
25. Display ads lead to a 155% increase in brand-specific searches post-ad exposure.
26. 75% of people say paid ads make it easier to find the information they need.
27. 72% of marketers believe relevancy is the key to successful content marketing.
28. 67% of smartphone users and 72% of computer or tablet users prefer ads customized to their city or zip code.
29. Consumers are 70% more likely to purchase a product when a company utilizes retargeting.
30. 46% of clicks go to the top three paid ads in search results.
Conclusion
These data points should be considered as ‘decision support’ tools in building your location-specific digital advertising roadmap. Some of these statistics may vary in importance based on your industry or customer persona,
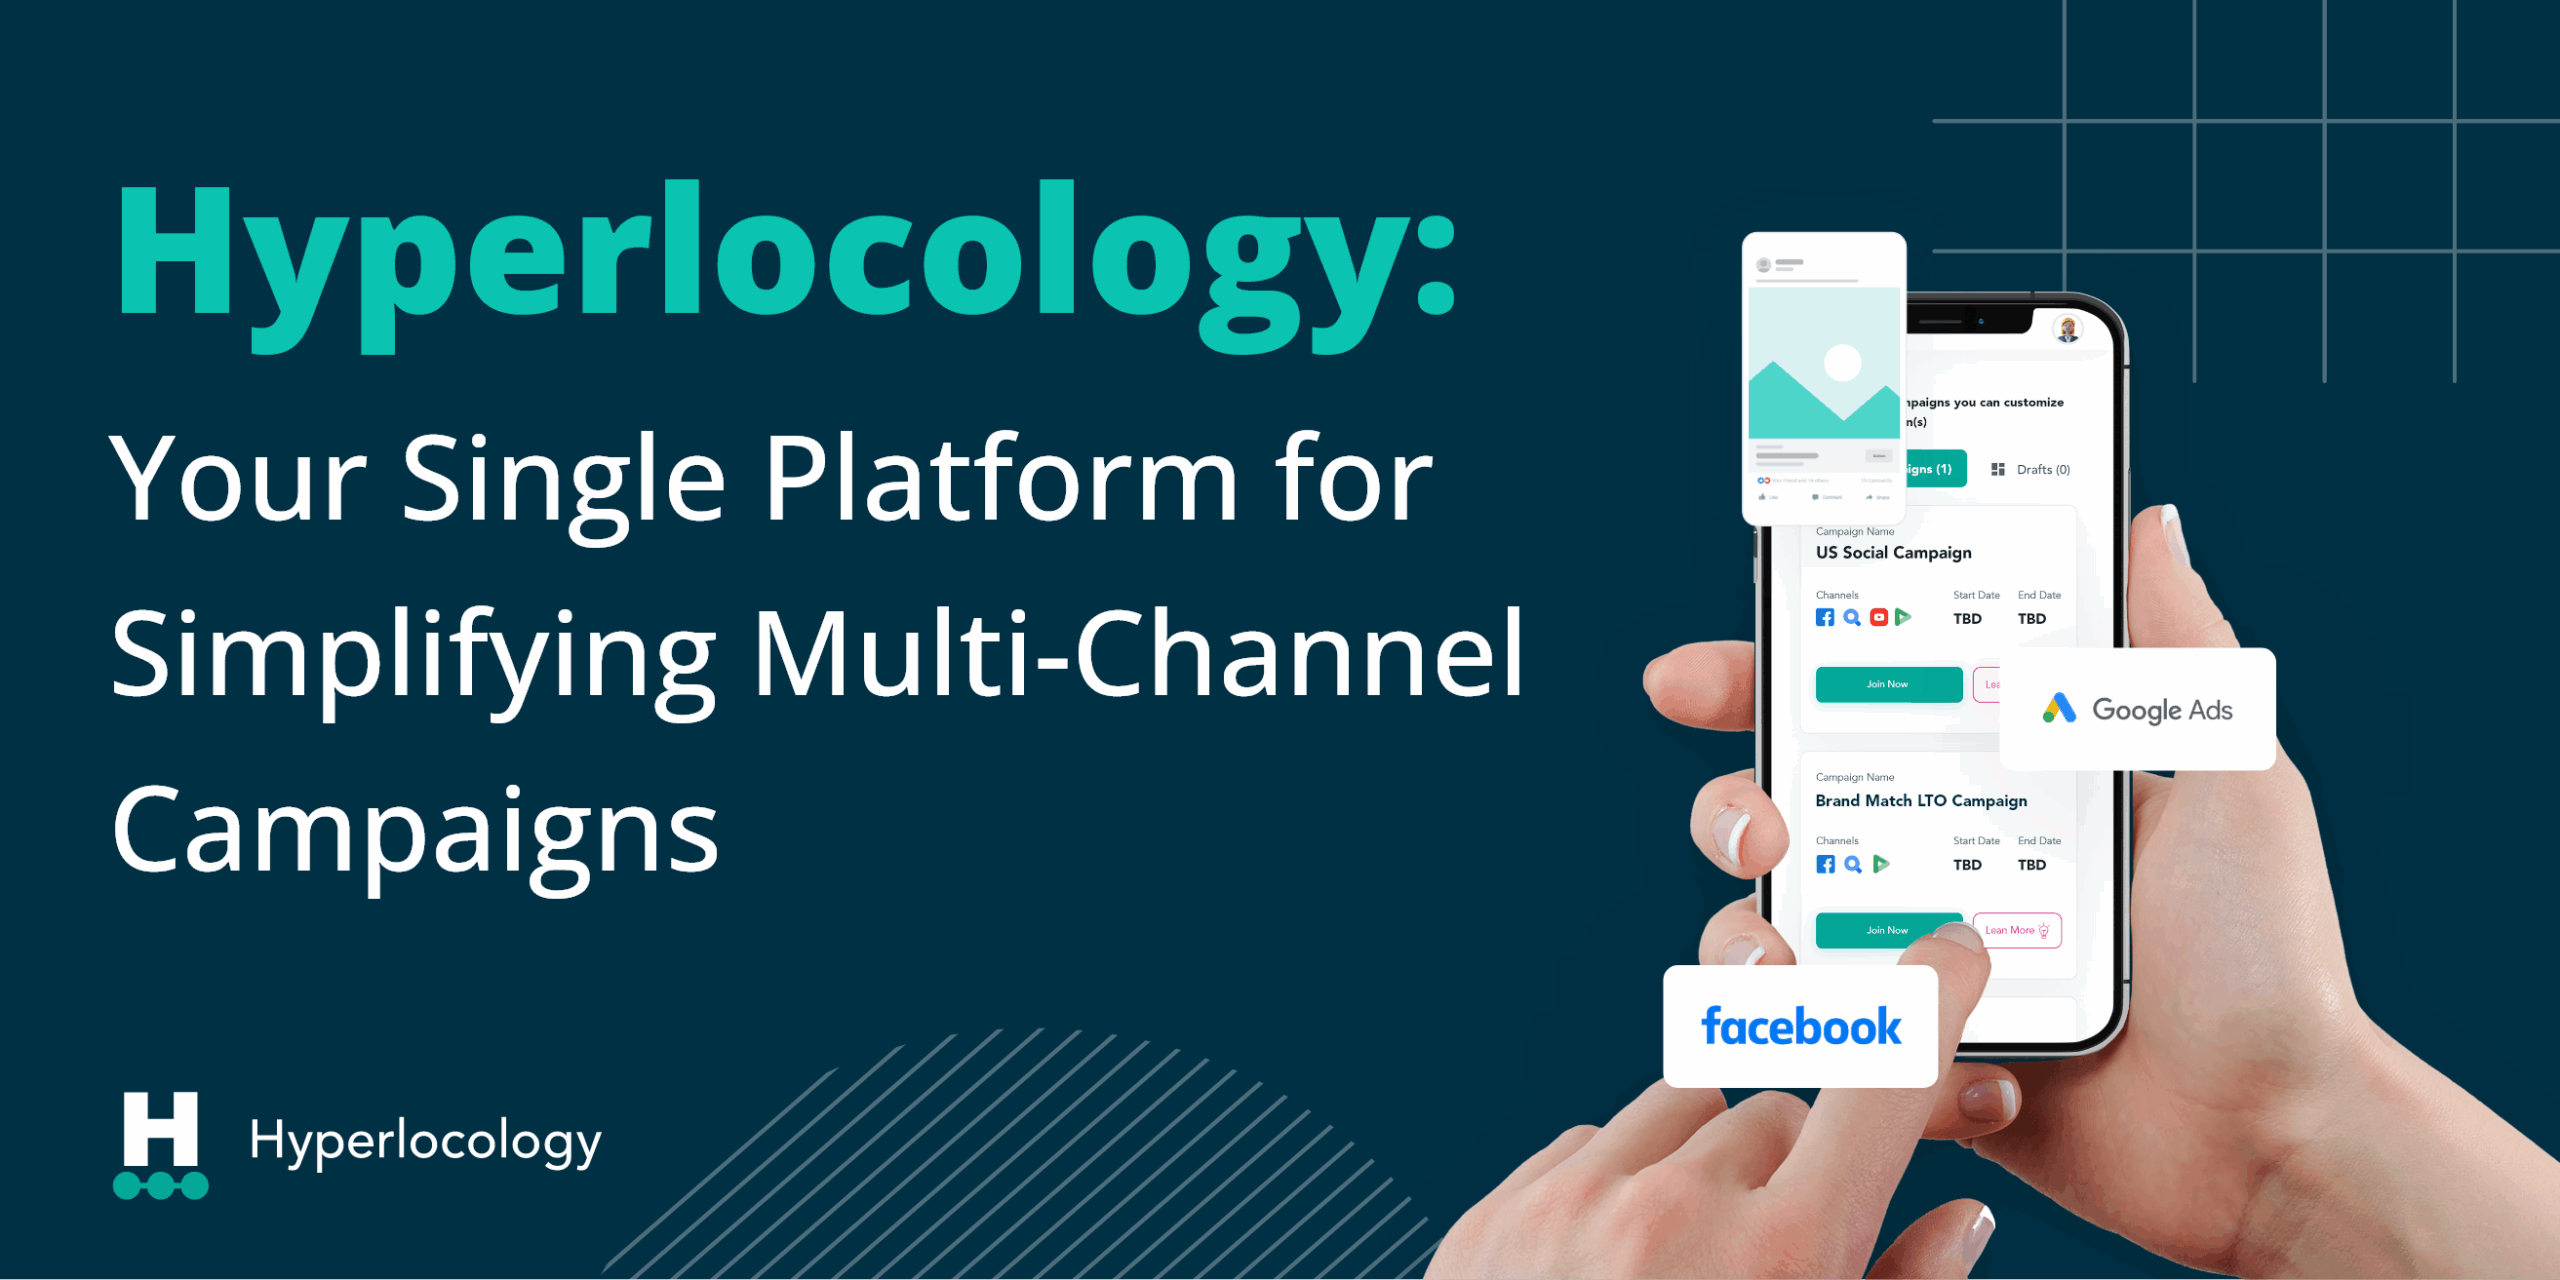
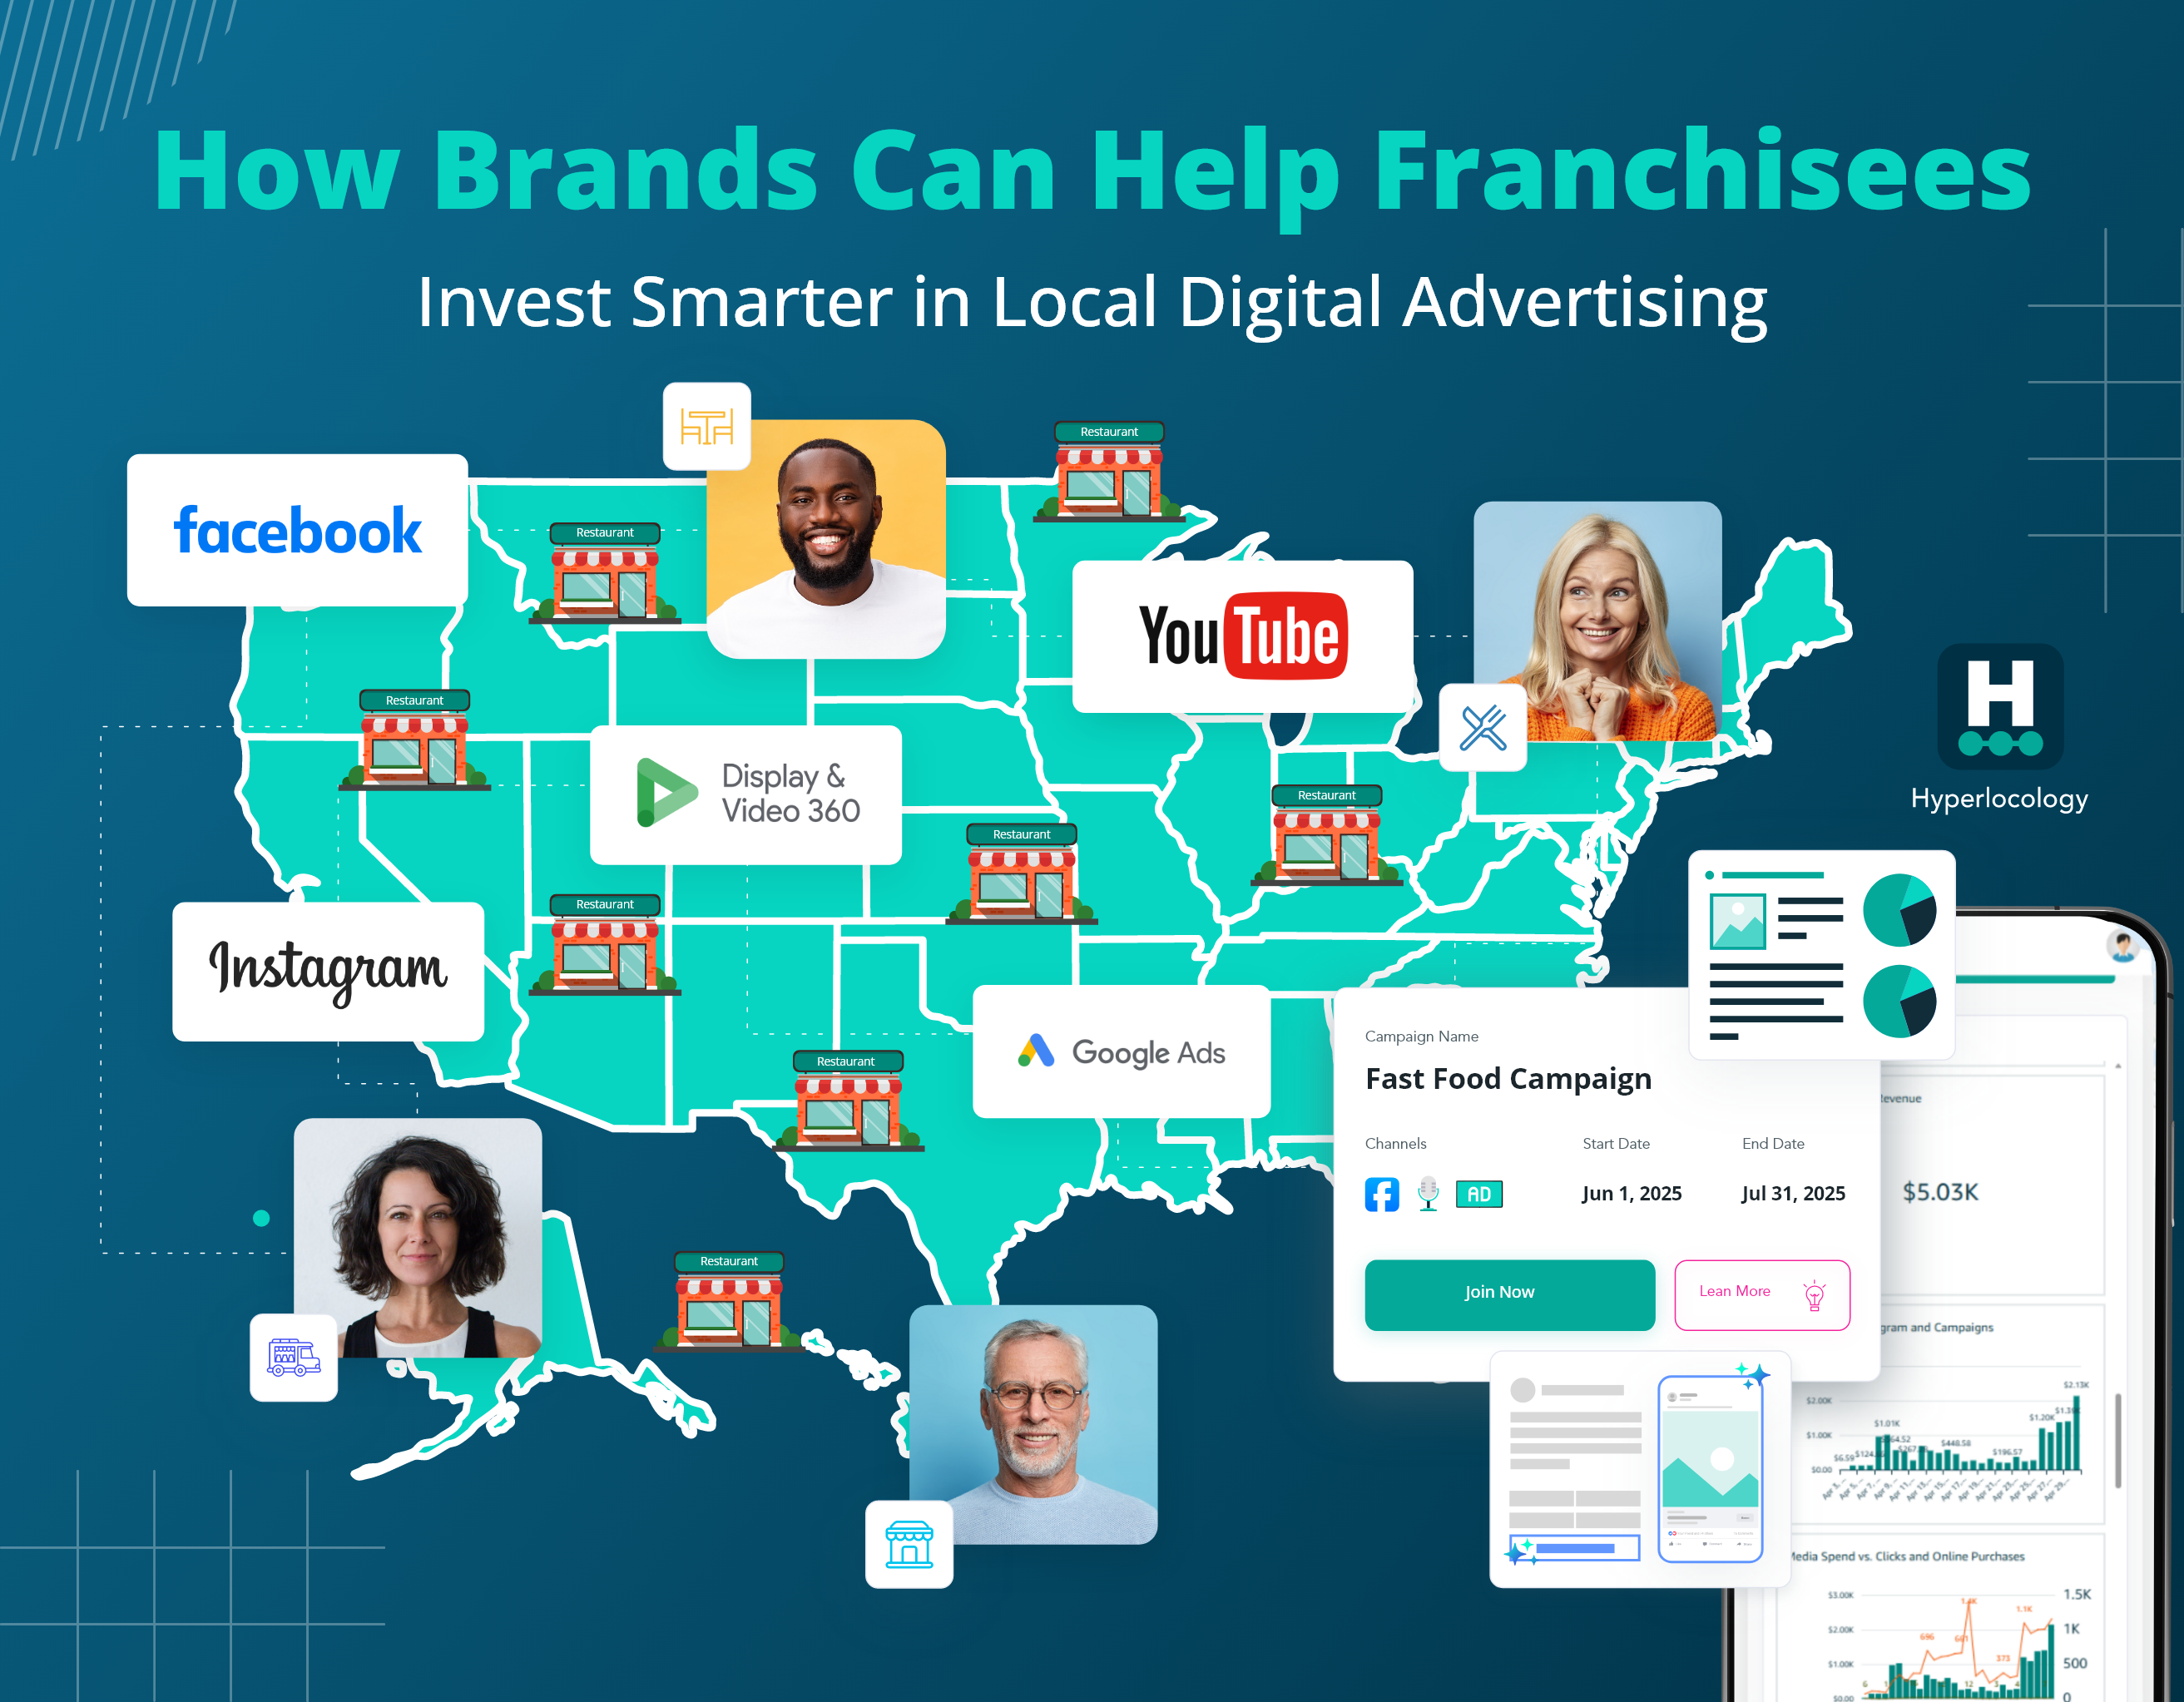
That’s why Hyperlocology exists – we’re an easy-to-use location-specific digital advertising platform that maximizes individual location performance, leveraging the custom audiences, channel mix and creative that is best for each franchise, retail or service location.
If you are not ‘fully equipped’ to address and maximize the data and trends noted above, the answer to the question below should be simple:
Ready to see the location based marketing experience on Hyperlocology?
{{cta(‘1a4ac542-2904-4df2-a415-33ddc908bfce’)}}
Resources
Start running smarter local campaigns today.
Let’s show you how Hyperlocology powers performance at every location.